
A P value tells you whether to accept or reject a given hypothesis. In CME, however, we often don’t have a hypothesis. Sure, we expect physicians who participate in CME to have changes in competency, performance, or maybe even their patients’ health, but we’re not very good at testing this directly via a single hypothesis (as compared to clinical drug trials). Our typical approach is to give CME participants a survey containing several knowledge/self-efficacy/case questions and then run t- or chi-square tests to see if they answer differently pre vs. post-activity (or even post-activity vs. a control group). This results in a P value for each question, which means that each question is essentially a hypothesis. If you’re going to have more than one hypothesis in a single study, you need to control for multiple comparisons. This is because each additional hypothesis applied to a single study increases the likelihood that any one difference uncovered is due to chance (as opposed to a true difference between the comparison groups).
For example, if you conduct a single statistical test and use the conventional P value (.05), there is only a 5% chance that you’ll reject your null hypothesis (i.e., find that a difference exists between groups) and be incorrect. But if you have a 20-question survey and you’re conducting a statistical test for each question, you now have a 64% chance of making one or more false findings (the formula from which this was derived can be found here).
Although I’d first recommend not conducting multiple comparisons, there aren’t many viable alternatives for most CME providers, and such an approach can have value for hypothesis generation. That being said, a simple way to address the multiple comparison issue is via the Simes-Hochberg correction [1,2].
Here are the steps:
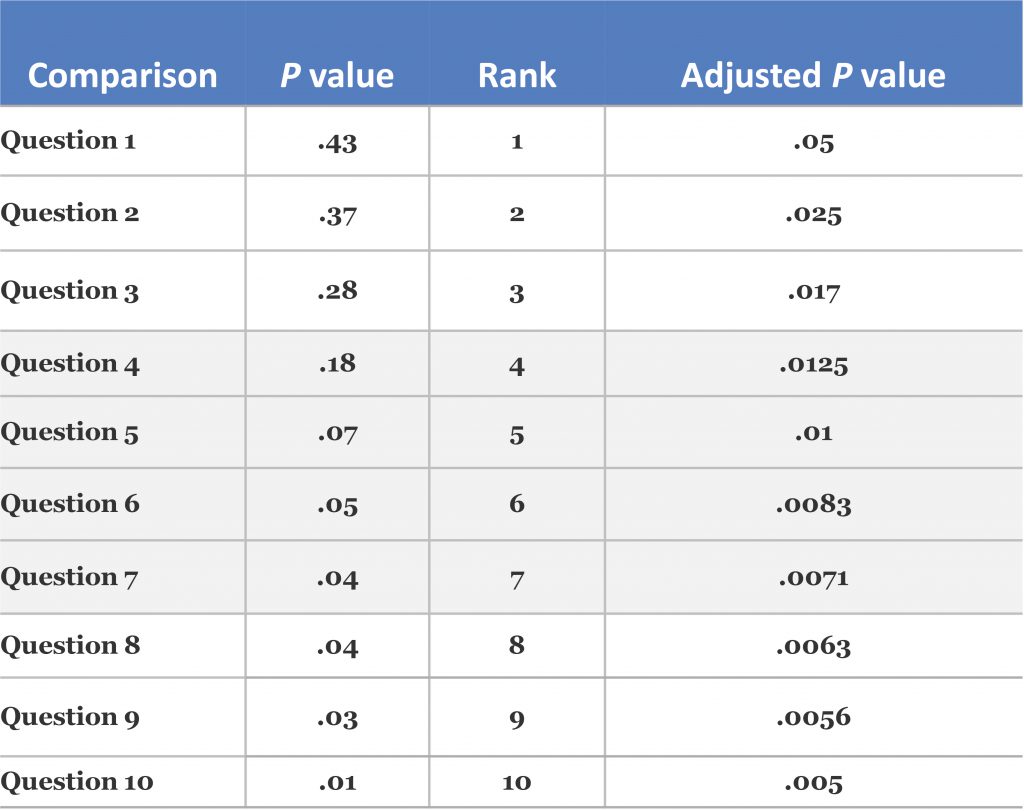
- After you’ve run all your statistical tests, order all P values from high to low
- If the highest P value is < .05, stop here; all tests are significant
- If the second-highest P value is less than < .025 (which is .05/2), then stop here; all following tests are significant
- If the third-highest P value is less than .017 (which is .05/3), then stop here; all following tests are significant
- And so on, comparing the P value with .05 divided by its ranking among all multiple comparison P values
Here’s an example (note that five comparisons were significant prior to the multiple comparison correction, after which none of the comparisons maintained statistical significance):
References:
- Simes RJ. An improved Bonferroni procedure for multiple tests of significance. Biometrika. 1986;73:751-54.
- Hochberg Y. A sharper Bonferroni procedure for multiple tests of significance. Biometrika.1988;75:800-02.