close
close
|
close
|
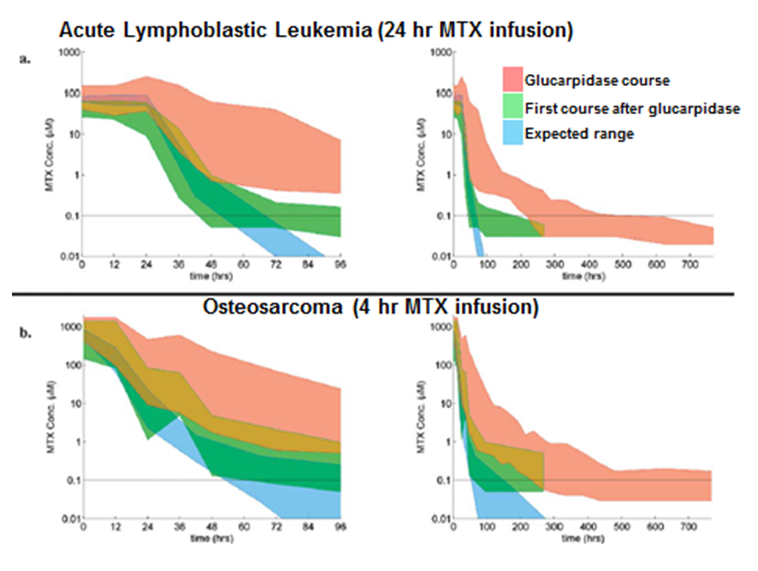
FIGURE 3. Plasma Methotrexate Concentrations During and After Glucarpidase TreatmentThis figure depicts plasma MTX concentrations during and after glucarpidase treatment in patients treated with various doses of HDMTX. The red areas indicate the HDMTX course during which patients received glucarpidase, and the green areas show the next HDMTX course after glucarpidase. The blue areas illustrate the expected clearance for the dose received. The top panels (a) shows patients who receive a 24-hour infusion of MTX 5 g/m2 (ie, a standard dose for acute lymphoblastic leukemia), whereas the bottom panels (b) shows patients who received a 4-hour infusion of 8 to 12 g/m2 of MTX (ie, a standard dose for osteosarcoma). Within these dose ranges, the left panel shows plasma concentrations over 96 hours, whereas the right panel shows 700 hours of follow-up data.
|